728x90
# 움직이는 GRAPH
n 움직이는 차트 생성
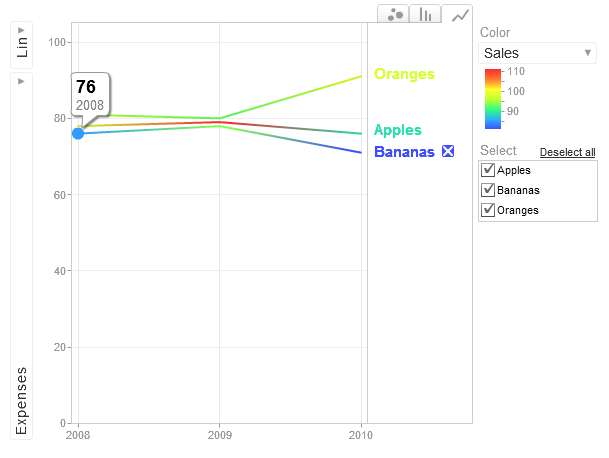
> install.packages("googleVis") > library(googleVis)
> t1 <- gvisMotionChart(Fruits,idvar="Fruit",timevar="Year") http://127.0.0.1:16880/custom/googleVis/MotionChartID12901d406cf1.html
|
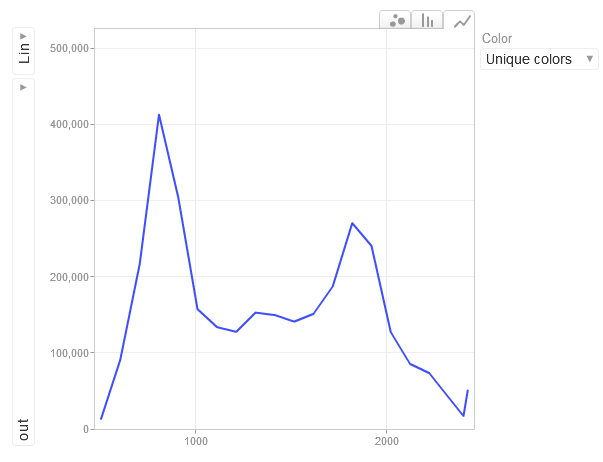
> line_clt <- read.csv("1-4호선승하차승객수.csv",header=TRUE) > t2 <- gvisMotionChart(line_clt,idvar="line_no",timevar="time") > plot(t2)
http://127.0.0.1:16880/custom/googleVis/MotionChartID12903eb6507e.html
|
> line2_clt <- read.csv("2호선_강남역_승하차현황.csv",head=TRUE) > t3 <- gvisMotionChart(line2_clt,idvar="line_no",timevar="time") > plot(t3)
http://127.0.0.1:16880/custom/googleVis/MotionChartID129075a51eea.html
|

'빅데이터과정 > R' 카테고리의 다른 글
| #50_140825_R_PIE CAHRT (0) | 2014.08.26 |
|---|---|
| #50_140825_R_TWITTER 분석 (0) | 2014.08.26 |
| #50_140825_R_AUDIO GRAPH (0) | 2014.08.25 |
| #49_140822_R_LINE CHART (0) | 2014.08.22 |
| #49_140822_R_BAR PLOT (0) | 2014.08.22 |