728x90
# REPORT
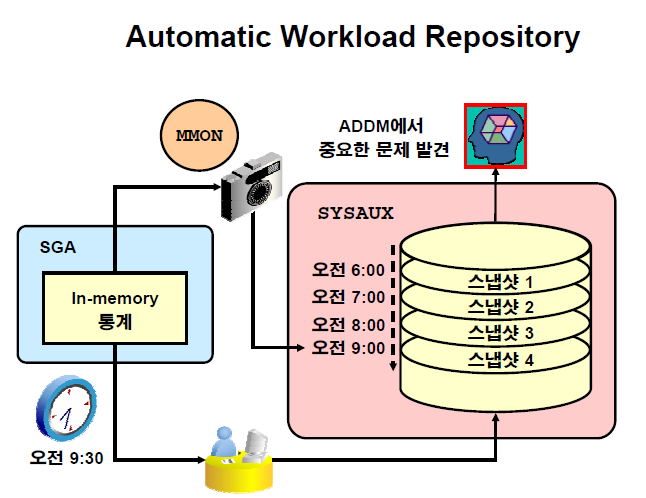
l 성능저하의 원인을 분석하기 위해서 오라클에서 제공하는 3가지 레포트
1. AWR report : 성능저하의 원인을 전반적으로 알려주는 레포트
2. ADDM report : 성능저하의 원인에 해결방법을 제공해주는 레포트
: @?/rdbms/admin/addmrpt.sql
3. ASH report : 최근에 발생한 악성 SQL과 대기이벤트를 보여주는 레포트
l 레포트 확인
SQL> @?/rdbms/admin/addmrpt.sql
SQL> @?/rdbms/admin/addmrpt.sql Instance DB Name Snap Id Snap Started Level ------------ ------------ --------- ------------------ ----- dbdb DBDB 101 24 Jul 2014 14:00 2 102 24 Jul 2014 14:30 2 103 24 Jul 2014 15:00 2 104 24 Jul 2014 15:30 2 105 24 Jul 2014 16:00 2 106 24 Jul 2014 16:35 2 Specify the Begin and End Snapshot Ids ~~~~~~~~~~~~~~~~~~~~~~~~~~~~~~~~~~~~~~ Enter value for begin_snap: 102 Begin Snapshot Id specified: 102 Enter value for end_snap: 105 End Snapshot Id specified: 105 ADDM Report for Task 'TASK_225' ------------------------------- Analysis Period --------------- AWR snapshot range from 102 to 105. Time period starts at 24-JUL-14 02.30.32 PM Time period ends at 24-JUL-14 04.00.59 PM Analysis Target --------------- Database 'DBDB' with DB ID 3193357653. Database version 11.2.0.1.0. ADDM performed an analysis of instance dbdb, numbered 1 and hosted at edydr1p0.us.oracle.com. Activity During the Analysis Period ----------------------------------- Total database time was 1922 seconds. The average number of active sessions was .35. Summary of Findings ------------------- Description Active Sessions Recommendations Percent of Activity --------------------- ------------------- --------------- 1 Top SQL Statements .2 | 56.76 1 2 "User I/O" wait Class .01 | 2.13 0 ~~~~~~~~~~~~~~~~~~~~~~~~~~~~~~~~~~~~~~~~~~~~~~~~~~~~~~~~~~~~~~~~~~~~~~~~~~~~~~ ~~~~~~~~~~~~~~~~~~~~~~~~~~~~~~~~~~~~~~~~~~~~~~~~~~~~~~~~~~~~~~~~~~~~~~~~~~~~~~ Findings and Recommendations ---------------------------- Finding 1: Top SQL Statements Impact is .2 active sessions, 56.76% of total activity. ------------------------------------------------------- SQL statements consuming significant database time were found. These statements offer a good opportunity for performance improvement. Recommendation 1: SQL Tuning Estimated benefit is .2 active sessions, 56.76% of total activity. ------------------------------------------------------------------ Action Run SQL Tuning Advisor on the SELECT statement with SQL_ID "btd1tv2fcrkdy". Related Object SQL statement with SQL_ID btd1tv2fcrkdy. select count(*) from sales a, sales b, sales c Rationale The SQL spent 100% of its database time on CPU, I/O and Cluster waits. This part of database time may be improved by the SQL Tuning Advisor. Rationale Database time for this SQL was divided as follows: 100% for SQL execution, 0% for parsing, 0% for PL/SQL execution and 0% for Java execution. Finding 2: "User I/O" wait Class Impact is .01 active sessions, 2.13% of total activity. ------------------------------------------------------- Wait class "User I/O" was consuming significant database time. The throughput of the I/O subsystem was not significantly lower than expected. The Oracle instance memory (SGA and PGA) was adequately sized. No recommendations are available. ~~~~~~~~~~~~~~~~~~~~~~~~~~~~~~~~~~~~~~~~~~~~~~~~~~~~~~~~~~~~~~~~~~~~~~~~~~~~~~ ~~~~~~~~~~~~~~~~~~~~~~~~~~~~~~~~~~~~~~~~~~~~~~~~~~~~~~~~~~~~~~~~~~~~~~~~~~~~~~ Additional Information ---------------------- Miscellaneous Information ------------------------- Wait class "Application" was not consuming significant database time. Wait class "Commit" was not consuming significant database time. Wait class "Concurrency" was not consuming significant database time. Wait class "Configuration" was not consuming significant database time. CPU was not a bottleneck for the instance. Wait class "Network" was not consuming significant database time. Session connect and disconnect calls were not consuming significant database time. Hard parsing of SQL statements was not consuming significant database time. End of Report Report written to report08.txt |
'빅데이터과정 > WORKSHOP 2 ' 카테고리의 다른 글
| #30_140724_WSHOP2_실행계획 (0) | 2014.07.25 |
|---|---|
| #30_140724_WSHOP2_오렌지 실행계획 오류 (0) | 2014.07.25 |
| #30_140724_WSHOP2_LARGE POOL (0) | 2014.07.25 |
| #30_140724_WSHOP2_SHARED POOL (0) | 2014.07.25 |
| #30_140724_WSHOP2_ORACLE MEMORY (0) | 2014.07.25 |